Don’t judge a book by its cover we are told, but I’ll admit that I’ve bought more than one volume based on its cover art. Those books haven’t always provided a life-changing literary experience, but what the heck? It was only a $10 gamble.
An investment in location intelligence to underpin a process digitization strategy is somewhat more than a $10 proposition and selecting the right tracking technology deserves more thought than a perusal of its cover. Here’s the thing though: tracking technologies are routinely compared based on a very surface-level view of performance, and often using precisely the wrong parameter: accuracy.
I should start by pointing out that all tracking systems make errors: when they say, “you are here” they mean, “you are roughly here but could be anywhere within this error circle.” We’ve all witnessed Google’s blue circle of confidence grow and shrink depending on how well GPS is doing at that moment. Behind the scenes your phone is getting many location updates which are jumping all over the place and Google’s dot is its best guess at where you probably are: the circle is the perimeter of the measurement jumps, any one of which could be where you actually are.
Why the errors? There are all kinds of reasons: the way objects in the environment distort and block the tracking signal, the physics of the signal and how it is detected and interpreted, the design of the tracking devices and the amount of noise they create within themselves etc. etc. There’s a long list of reasons that cause tracking systems to make measurements that jump all around your actual location, but the fundamental constant is that all tracking systems will (now and forever) make some degree of error when measuring location.
But how much?
Location Technology and Pub Games
Let’s go back to Google’s blue circles and think about what’s going on there, and to do that it’s useful to think about the game of darts. You can define a darts player’s performance by determining whether the dart lands where he or she was aiming – their accuracy, you might say. Let’s say the goal is a bull’s eye, and you measure a player’s performance by giving them one hundred throws and counting how many darts are on target.
OK, so far so good. We’ll give a hundred darts to a professional player and we would expect that they could hit a bull’s eye almost every time. Me? Not so much – I’d scatter darts all over the board and potentially one or two in the wall beyond the board, but out of a hundred I might score a bull’s eye. Give me a thousand throws and I’d bet you money that at least one of them would land where I was aiming.
Now, ask me and the pro whether we can both hit a bull’s eye and we might confidently say “yes!” Sure enough I’d blush a bit, but give me enough darts and I’m your man. You wouldn’t want me on your team though, would you? You would have very little confidence in my dart throwing accuracy.
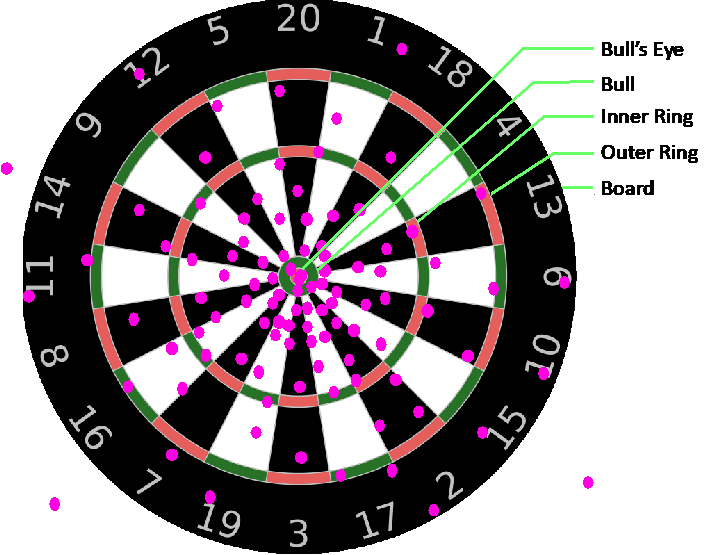
So let’s be a bit more scientific and define confidence as a performance parameter that sits alongside accuracy. Let’s define a dart player’s performance not based on whether or not they hit the bull’s eye, but how far from the bull’s eye each dart lands. We can then apply some metrics to determine performance. Here are my 100 throws:


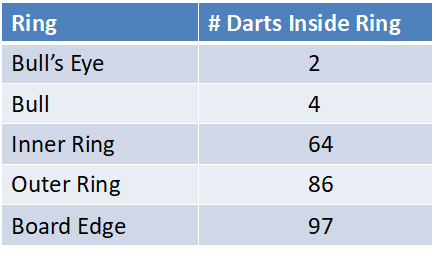
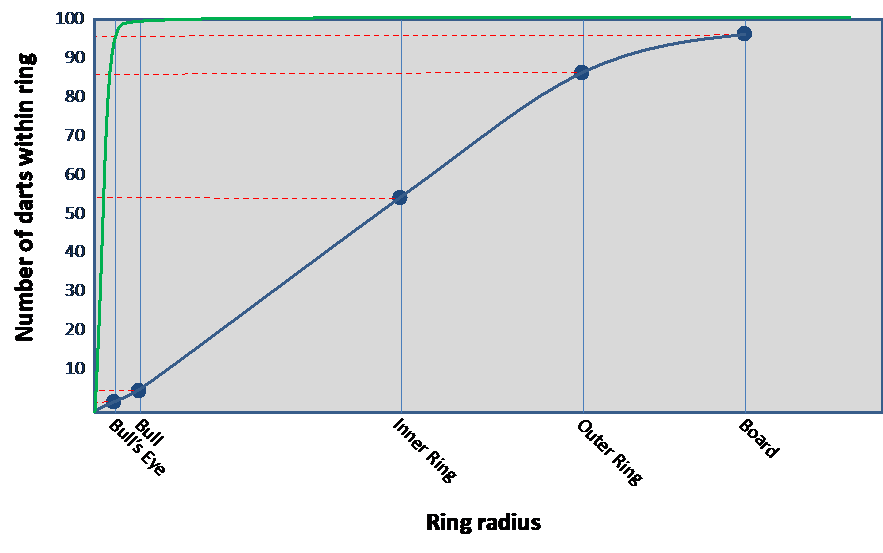
As you can see, I didn’t do too well. The table shows how many total darts I got inside each ring, for example the 64 in the inner ring includes the darts in the bull and bull’s eye too. As we go out from the center we’re counting how many total darts are accumulating inside that radius. If we actually measure the radius of the rings we can plot the results in the table on a graph like this:

The blue line is me, and the green line suggests how a professional player might score, getting virtually all darts within the bull and most of those in the bull’s eye itself.
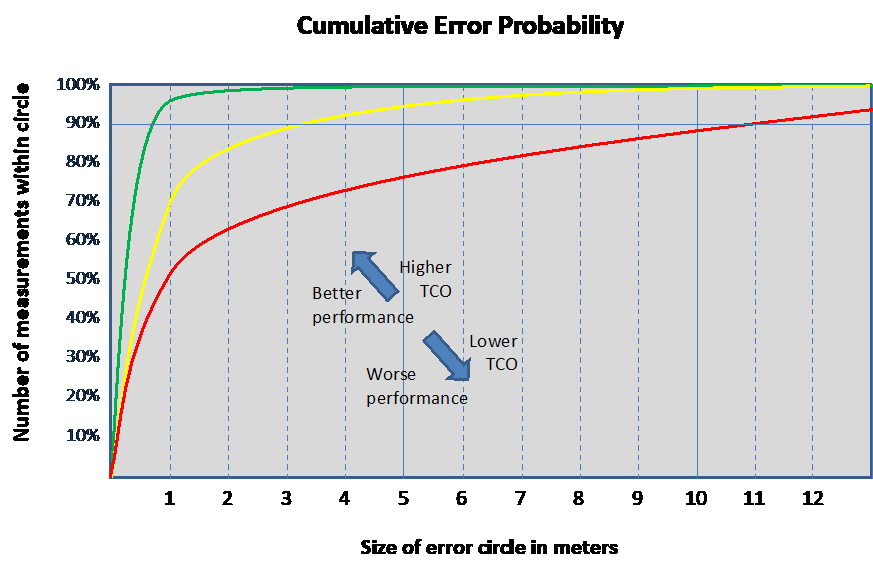
The graph we just drew to highlight why my darts career never really took flight is called a “cumulative error probability” graph. The exact same principle can be applied to tracking systems: here we define the error as the distance from the actual object location that the tracking system returns as a measurement, and we plot the vertical axis in terms of percentage. Here’s how that looks:

Just as with throwing darts, the green line shows a much higher performing tracking system than the red line. The further the curve heads up into the top left corner, the better the tracking system you are looking at.
Life is not so simple of course: in very broad terms the Total Cost of Ownership of a tracking system increases in the direction of the green line and decreases in the direction of the red line, and this is mostly attributable to the cost and longevity of tracking tags. The bottom line though is that you do get what you pay for, so a decision needs to be made about performance vs. TCO.
The Most Important Thing You Will Ever Learn About Tracking Systems
Let’s have a look at our cumulative error curve and read it in a couple of ways. The traditional question is to ask: can you achieve 1m accuracy (1m being some fantastical threshold of performance that has crept into our culture as the definition of goodness). Being the cheeky darts players that they are, the three vendors on our graph will all say, “Yes! Of course!” They won’t be so keen to tell you the confidence number though: reading up from 1m error we see that the red vendor will achieve 1m or better accuracy 50% of the time, the yellow vendor 70% of the time, and the green vendor 95% of the time.
Stating that in a more telling way: when promising 1m accuracy, the red vendor will be wrong 50% of the time, the yellow vendor will be wrong 30% of the time, and the green vendor will be wrong 5% of the time. What you have to ask yourself is not “what accuracy do I need” but “how often can I tolerate the wrong answer?” meaning “how critical is my process?”
If we read the curve in a more insightful way we have to start with confidence: you have defined that your process can tolerate a 5% error rate and still return a positive RoI for this investment. Now you can compare vendors by asking their error at the 95% confidence level and things get ugly fast: the green vendor answers, “1m,” the yellow, “3.3m,” and the red “11m.” Ouch, Red: ouch….
And so to The Most Important Thing: contrary to popular belief and marketing rhetoric, tracking systems do not exist on a continuum of accuracy but a continuum of confidence.

To the left we tend towards higher TCO systems that support highly critical process, and to the right towards lower TCO systems that are perfectly adequate for less critical processes. This is exactly the point: the error rate that your process can tolerate is the defining factor in which tracking solution to select. Accuracy is key, yes, but by itself it is a more-or-less meaningless parameter.
If you think about tracking systems along accuracy rather than confidence lines and succumb to the 1m threshold that’s currently in vogue, then you get this:

That’s just not a good way to select a tracking system because all RFP responses will look exactly the same in terms of performance: everyone will respond in the green zone. Your requirement has two parameters: accuracy and confidence, and it’s the confidence number that separates the responses.
So here’s how you do it:
- Define your accuracy requirement, for example: 2m. (Yes, accuracy must be defined, but don’t stop there. There’s an art to this, and perhaps I’ll tackle that in anther blog post.)
- Consider the criticality of your process and define an acceptable error rate. Let’s say 1 in 1,000, or 0.1%
- Subtract that from 100% to get your required confidence level: 99.9%
- Ask your vendors about their 2m confidence percentage in a physical environment similar to yours (not in their lab, but out here in the real world with all the messy bits).
- Disqualify everyone who responds less than 99.9%
- Pick between the remainder based on your other requirements.
If you don’t go through those steps then it’s easy to get hoodwinked by completely ignoring the confidence factor. Confidence is the single most important discriminator of tracking systems and the one that nobody considers, so it’s time we started talking about it.
Now, if you STILL think that accuracy is all you need to specify then I have my own darts and I’m normally free on Thursday evenings.

Written by Adrian Jennings, Chief Product Advocate at Ubisense
Adrian’s role as a spokesperson for Ubisense takes him all over the world, working with all sorts of organizations, accelerating the adoption of SmartSpace to transform processes. Adrian is a recovering rocket scientist, and as designated UK intelligence expert spent three years as a missile consultant with the US Department of Defence. He received a master’s degree in physics from Oxford University and now finds himself bemusedly working for a Cambridge company.
